BDSwiss App
Download & start trading

Today, let’s dive into XAUUSD and USOIL in commodities, EURUSD in forex, BTCUSD in cryptocurrency, and Tesla in stocks. We’ll explore their recent performances, current positions, and anticipate potential movements by week’s end.
EURUSD
Technical Analysis 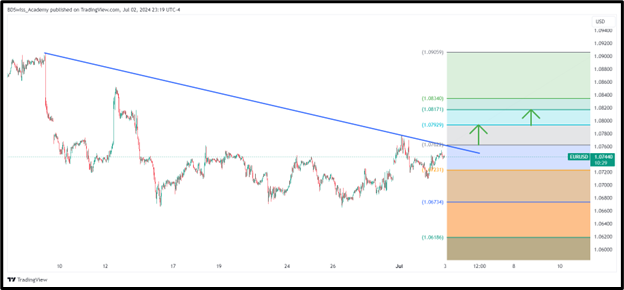
A potential downtrendline breakout to the upside is identified on the 1-hour chart of EURUSD at 1.07622.
Upside Targets: If the breakout holds, there is a strong probability of the exchange rate rising to 1.07929. Further upside momentum could push it towards 1.08171 upon surpassing the 1.07929 level.
Downside Scenarios: Conversely, if the breakout fails, there is a significant likelihood of the exchange rate declining to 1.07231. Breaking below 1.07231 could lead to further downside towards 1.06734.
Apply Risk Management
Fundamental Analysis
EUR/USD remained trapped in a consolidating range on Tuesday, hovering near 1.075 amid chart churn, while awaiting pivotal HCOB PMIs and US ADP jobs data due later this week. The pair struggled to establish clear momentum ahead of critical economic indicators, with US labor statistics and scattered EU economic data set to influence market direction throughout the remainder of the trading week.
XAUUSD
Technical Analysis 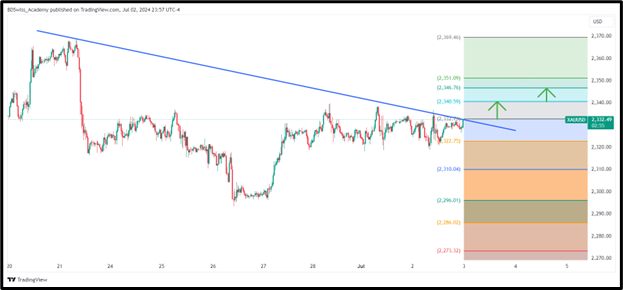
– An XAUUSD uptrendline breakout to the upside is identified on the 30-minute chart at $2332.73.
– Potential Upside Targets: If the breakout holds, there is a strong likelihood of the price ascending to $2340.59. Breaking above $2340.59 could lead to further gains towards $2346.76.
– Potential Downside Targets: Conversely, if the breakout fails, there is a significant probability of the price declining to $2332.75. Breaking below $2332.75 could result in further downside towards $2310.04.
Apply Risk Management
Fundamental Analysis
Traders are holding off, awaiting clearer signals regarding the Federal Reserve’s stance on interest rate cuts. The upcoming release of FOMC meeting minutes is pivotal, expected to provide direction before the Non-Farm Payrolls (NFP) report on Friday, influencing market sentiment.
BTCUSD
Technical Analysis 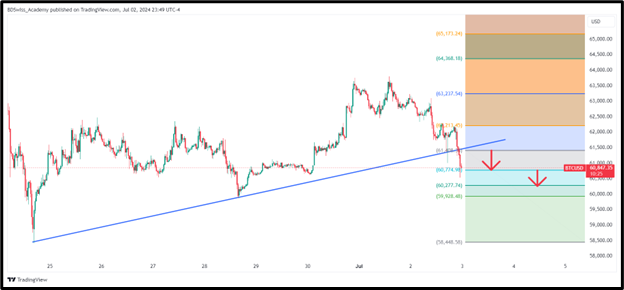
A BTCUSD uptrendline breakout to the downside is observed on the 30-minute chart at $61408.36.
Downside Targets: If the breakout holds, there is a strong probability of the price declining to $60774.98. Breaking below $60774.98 could lead to further downside towards $60277.74.
Upside Scenarios: Conversely, if the breakout fails, there is a significant likelihood of the price rising to $62213.45. Breaking above $62213.45 could result in further upside towards $63237.54
Apply Risk Management
Fundamental Analysis
On Friday, the U.S. Department of the Treasury and IRS unveiled finalized tax reporting regulations for digital asset brokers, outlining mandatory annual reporting set to commence in 2026, encompassing gross sales from 2025 onward. Experts emphasize the critical task for investors to assign basis, determining original purchase prices for each crypto wallet before 2025 to comply with the new regulations effectively.
USOIL
Technical Analysis 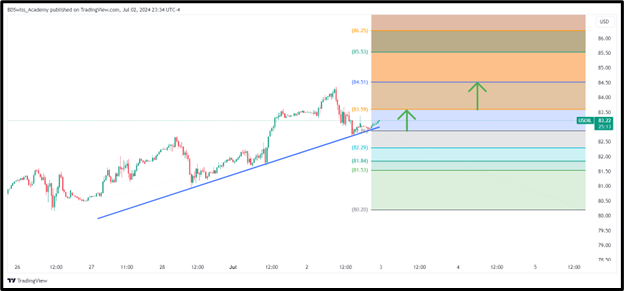
An uptrendline rejection is identified on the 30-minute chart of USOIL at $82.86.
Potential Upside Targets: If the rejection holds, there is a strong likelihood of the price climbing to $83.59. Breaking above $83.59 could lead to further gains towards $84.51.
Potential Downside Targets: Alternatively, if the rejection fails, there is a significant probability of the price falling to $82.29. Breaking below $82.29 could result in further decline towards $81.84.
Apply Risk Management
Fundamental Analysis
Oil prices climbed higher on Wednesday fueled by a larger-than-forecast drawdown in U.S. crude inventories, coupled with escalating tensions in the Middle East. The latest Reuters survey revealed that OPEC’s oil production increased in June for the second consecutive month. This rise was driven by heightened outputs from Nigeria and Iran, countering the effects of voluntary production cuts from other member nations and the broader OPEC+ coalition.
TESLA
Technical Analysis 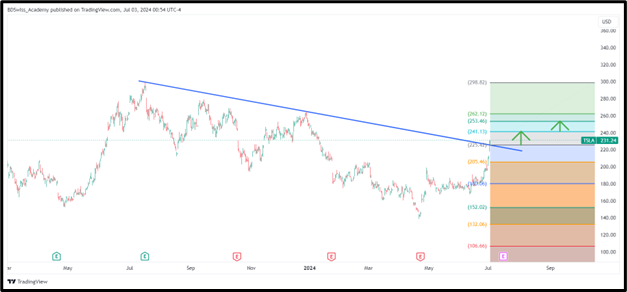
TESLA (NASDAQ: TSLA) has observed a bullish breakout above a downtrend line on the 4-hour chart at $225.42.
If the breakout sustains, potential upside targets include $241.13, with further resistance at $253.46 if breached.
Conversely, failure of the breakout could lead to a potential downside target of $205.46. Further decline below $205.46 may push the price towards $180.06, indicating increased bearish sentiment.
Apply Risk Management
Fundamental Analysis
Tesla shares surged 10% following an impressive Q2 deliveries report, revealing 410,831 vehicles produced and 443,956 delivered, surpassing Wall Street’s expectations. Despite this bullish momentum, the total deliveries dipped 4.8% year-over-year, reflecting a mixed sentiment in the market.
Sources:
https://www.fxstreet.com/currencies/eurusd
https://www.fxstreet.com/markets/commodities/metals/gold
https://www.cnbc.com/2024/07/01/irs-crypto-tax-reporting-guidance.html
 Da-Costa Assumang
Posted on 05 July, 2024 at 11:17 GMT
Posted on 05 July, 2024 at 11:14 GMT
Posted on 05 July, 2024 at 11:11 GMT
Posted on 05 July, 2024 at 11:07 GMT
Posted on 05 July, 2024 at 11:03 GMT