


Market Analysis Review
Biden Enthusiasm, Vaccine hopes Push US Stocks to record; UK spending Review, US jobless Claims, Tons of other US data
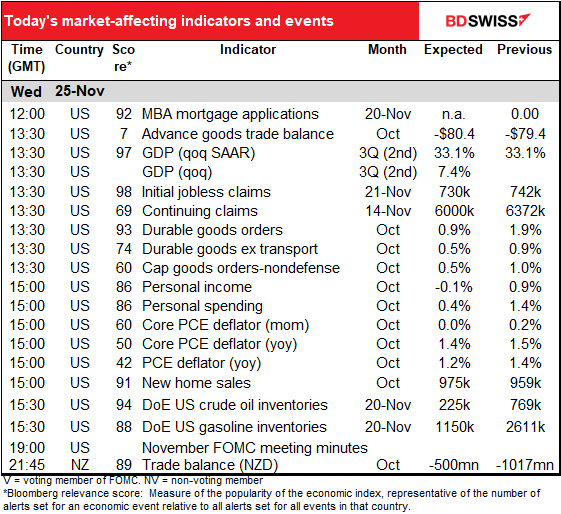
Note: The table above is updated before publication with the latest consensus forecasts. However, the text & charts are prepared ahead of time. Therefore there can be discrepancies between the forecasts given in the table above and in the text & charts.
Rates as of 05:00 GMT

Market Recap
Euphoria time in the stock market as the stock indices – both S&P 500 and DJIA – hit record highs (not the NASDAQ though as tech stocks underperformed the broader equity market). The DJIA broke through the 30,000 level for the first time, which made for nice headlines on the evening news and brought Trump out for perhaps the shortest press conference of his career (62 seconds). Oil also rose sharply, while gold and silver fell and the Treasury yield curve bear steepened (long rates rose more than short rates), which indicates expectations of stronger economic activity in the future.

The reason behind the surge was President-Elect Biden officially beginning his transition period, finally. Michigan and Pennsylvania certified Biden’s victories, effectively ending Trump’s attempt to steal the election, and the head of the General Services Administration (GSA) reluctantly acknowledged he was the winner, freeing up a variety of government resources for the incoming administration. That eliminates the lingering political uncertainty in the US and will make the transition smoother. The market was also relieved to see Biden’s choice for various posts – so far he is appointing competent, experienced people, not industry lobbyists and campaign donors. In particular, expectations that Biden would appoint the dovish former Fed Chair Janet Yellen as Treasury Secretary boosted confidence that the fledgling administration’s fiscal authorities would coordinate well with the Fed to emphasize reflation and rebuilding.

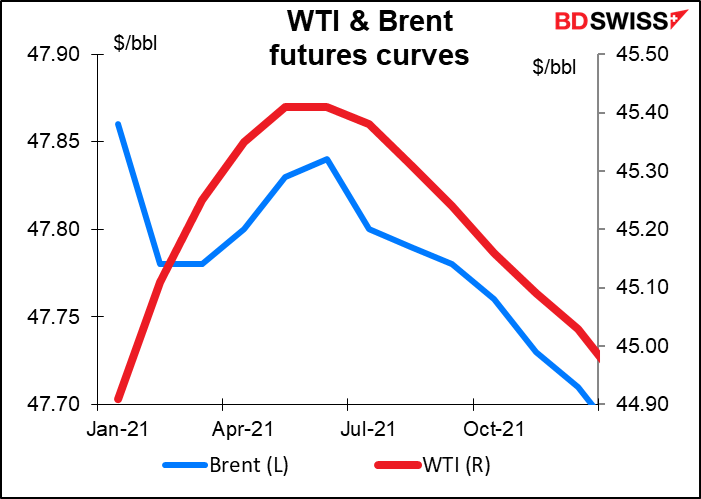
We can also discern in the market evidence of hope for the “light at the end of the tunnel” – that the three successful vaccines announced so far would free us from the lockdowns and other restrictions and economic activity would return to normal. These expectations manifest themselves clearly in the oil futures curves, which are predicting a boost in demand starting in the spring – presumably as the vaccines become more widely available and activity picks up — peaking in May or June.
This kind of “normalization trade” can be seen readily in the stock market, where small-cap stocks are outperforming large-caps and “real-life” companies are outperforming “virtual world” companies. There were strong performances in the travel industry, such as cruise company Carnival (+11.3%), United Airlines (+9.9%), and MGM Resorts. Bank stocks gained further on expectations that there would be fewer bankruptcies and higher interest rates, while energy stocks rose along with oil prices.
Against this background, the FX market response was predictable: JPY and CHF down, commodity currencies up. The performance of EUR and USD though was notable: USD flipped back into the “safe-haven” category and fell while EUR gained.
It was significant that AUD/CAD was higher even though oil was up over 4%. This suggests to me that the move was more psychological than calculated. Either that or perhaps people are more enthusiastic about Australia’s prospects because of its much lower virus load, which suggests things may get back to normal there earlier than in other countries. In the last seven days, Australia averaged 12 new cases a day, vs 5,033 for Canada.

I should point out though that the market consensus forecast last week was for a 9k decline too. My guess is that people really have no clue and are just pulling numbers out of a hat, or perhaps using the Gittler Super-Duper ANOVA, ANCOVA, MANOVA, & MANCOVA Forecasting Technique, which boils down to Excel’s RANDOM() function.
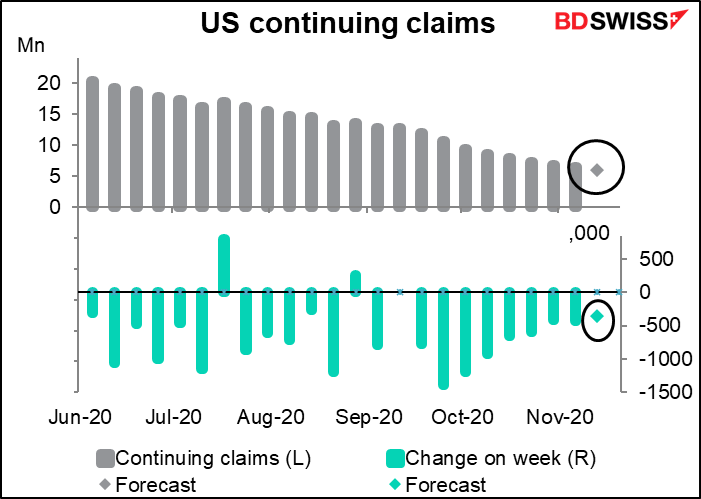
Continuing claims are expected to fall 372k vs last week’s 429k decline. Here too, the market consensus forecast is astonishingly similar to last week’s forecast of a 386k decline, giving further evidence of the “stopped clock” approach to forecasting, which is to simply forecast the same thing every time.
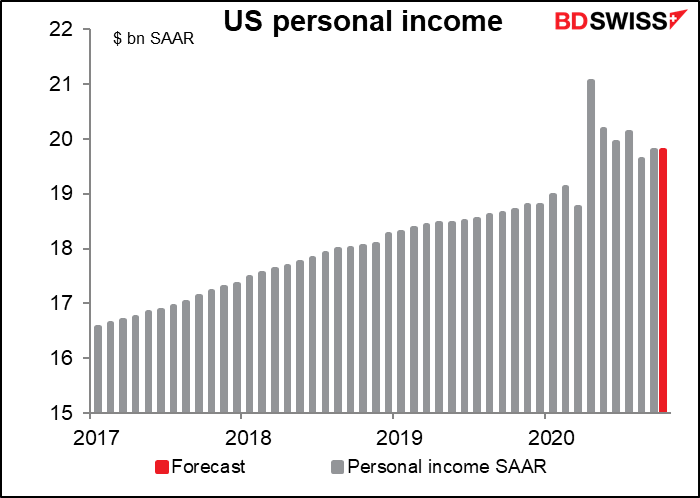
Although the Bloomberg relevance scores say that durable goods are next, I think personal income & spending are more important nowadays, because with personal consumption making up 70% of the economy, that’s the key to economic health nowadays. Durable goods are useful for tracking the business cycle, but this isn’t the typical business cycle by any means.
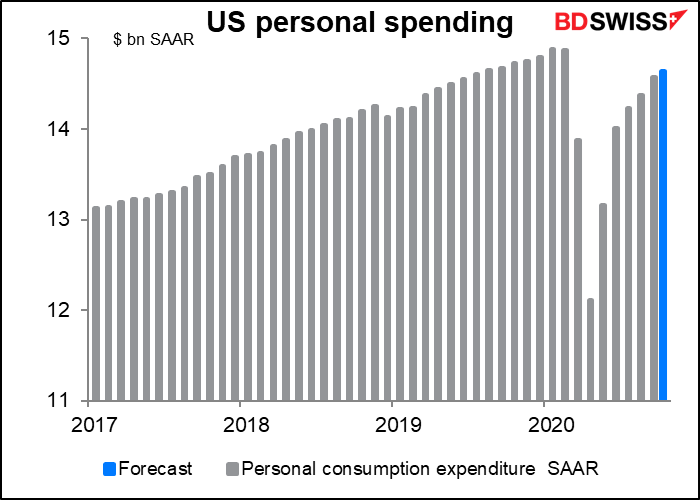
Personal income is expected to be unchanged. The reasoning must be that the fall in unemployment benefits is being balanced by an increase in people with jobs. Meanwhile personal spending is expected to be up a modest +0.4% mom, the smallest gain since the big collapse in April. The two go hand-in-hand of course.
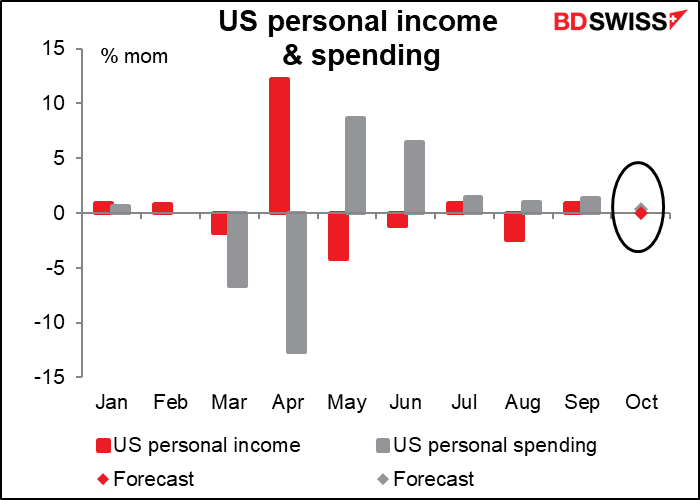
Looking at the level of income & spending, incomes are expected to be still some 4% above pre-pandemic levels, while spending is forecast to be about 1.6% below. It’s clearly going to be hard for spending to recover further if incomes fall from here, as they are likely to do.
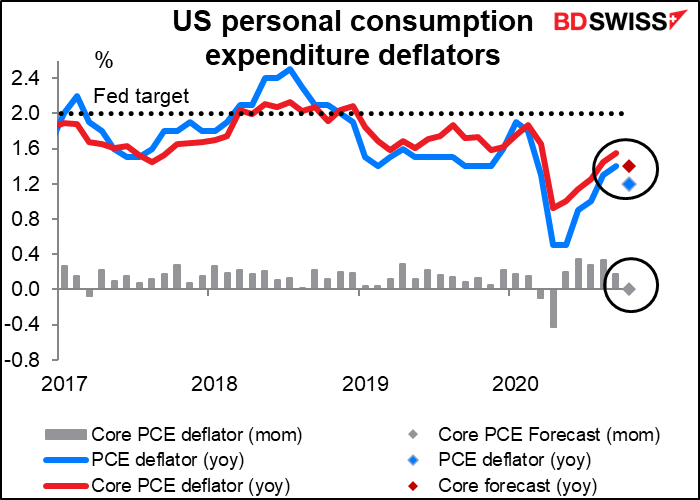
The personal consumption expenditure (PCE) deflators, the Fed’s preferred inflation gauges, are expected to show a slowdown in inflation. In the past that might have sounded alarm bells about further Fed easing. Today, people are far more worried about the collapse of the economy than where inflation is. The personal income figures above are probably more germane to Fed policy than the inflation data. Instead, falling inflation would just mean higher real yields, which might support the dollar and push gold down.
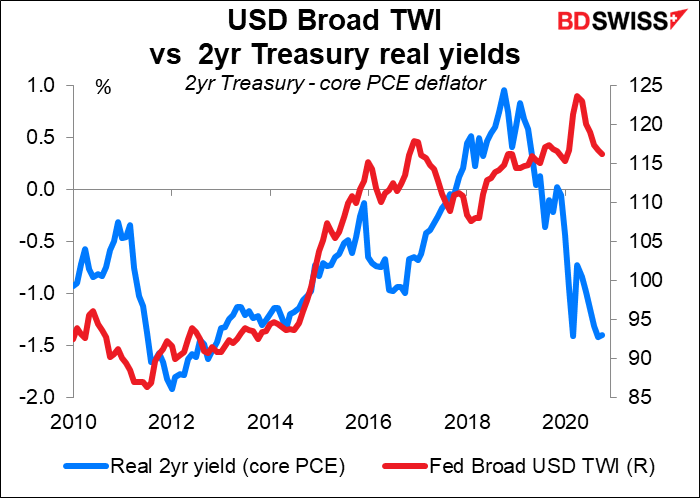
Although the link between real yields and the dollar seems to have been severed early in 2019, when US real yields started their precipitous decline but the USD continued climbing. (Of course we should be looking at relative interest rates, not just US rates, but as other nation’s bond markets tend to follow the Treasury market to some degree and the variance in global inflation has been declining, this is a decent rough estimate. And it generally worked from 2011 to 2019, except for that big drop in 2016.)
Durable goods orders are expected to rise modestly, as they did in the previous three months.
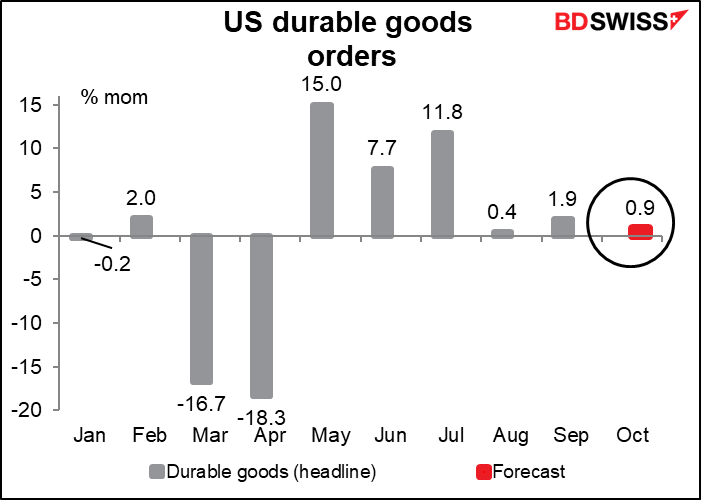
They are expected to be 1.8% below pre-pandemic levels.

One of the main reasons durable goods orders haven’t yet fully recovered is continued weakness in the aircraft industry. Boeing reported no new orders in September or October. Excluding transportation equipment, orders recovered back to the pre-pandemic level in July and this month they’re expected to be 2.3% above pre-pandemic levels.

US new home sales are expected to be up 1.5% mom. This compares to a 4.3% mom rise in existing home sales.
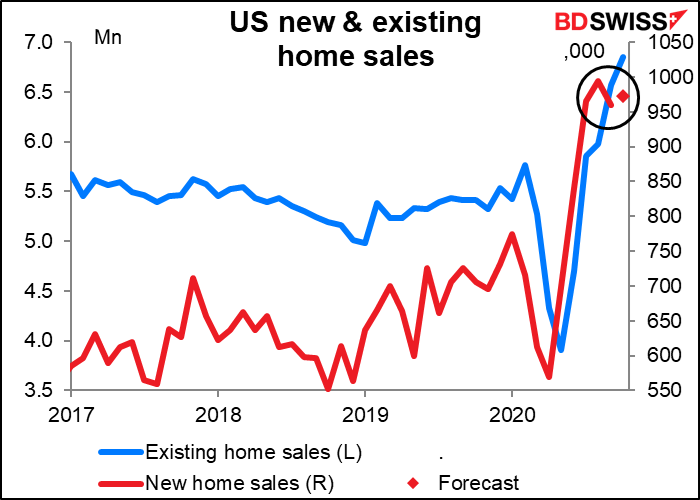
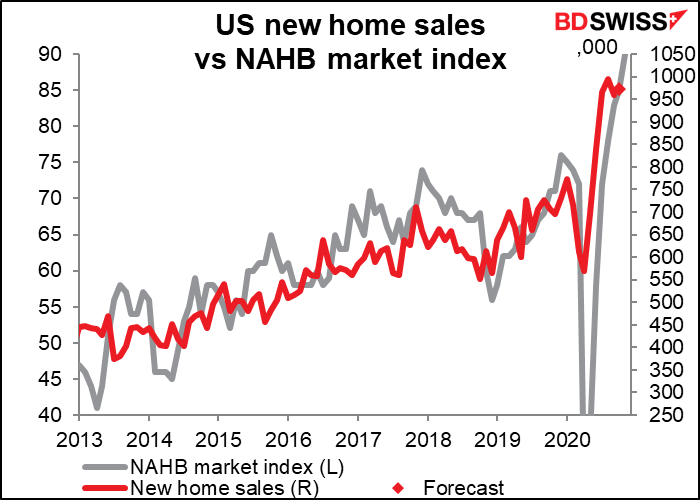
I suspect that the reason new home sales are lagging existing home sales is not because of lack of demand but rather because of lack of supply. Building was constrained earlier in the year and now can’t keep up with demand. That’s why the National Association of Home Builders (NAHB) sentiment index is through the roof, so to speak (hahaha). It was already at a record high of 85 in October and then jumped another 5 points in November.
You may wonder why I’ve left the second estimate of US Q3 GDP to so far down the list. That’s for two reasons. First off, I don’t expect any meaningful revision. And secondly, nowadays “past performance is no guarantee of future performance” is the keyword when looking at indicators. The markets are obsessed with daily or weekly data, such as the jobless claims, never mind what happened back in July-September.
Later In the day we get what might actually be the most important announcement of the day: the minutes of the 5 November meeting of the Federal Open Market Committee (FOMC), the rate-setting body of the US Fed. Fed Chair Powell indicated in his press conference after the meeting that officials discussed their $80bn-a-month asset purchase program at some length, although they didn’t reach any firm conclusions. The minutes may also provide greater detail on how the Committee is thinking about potential changes to the Fed’s quantitative easing (QE) program, and perhaps some clues as to what changes if any they would like to make in their forward guidance.
Is that enough? I haven’t gone through the MBA mortgage applications or the US advance trade balance. And we’ve also got the US oil inventory figures coming out, which may be important ahead of next week’s OPEC+ meeting. Nonetheless, I’m going to give the US indicators a rest here. Enough is enough.
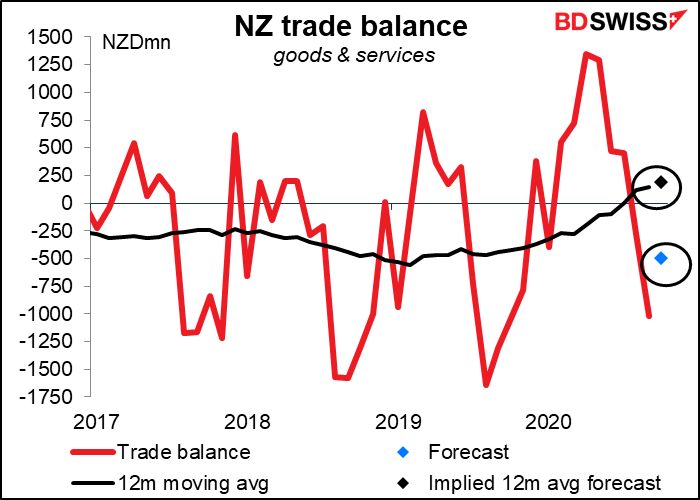
Overnight, New Zealand announces its trade data. The deficit for the month is expected to narrow a bit as exports rebounded somewhat. The numbers aren’t seasonally adjusted, so I find it more useful to look at the 12-month moving sum. That’s expected to continue rising slightly, which may help NZD.

 BDSwiss
Recent Posts
Posted on 02 May, 2025 at 12:00 GMT
Posted on 29 April, 2025 at 12:00 GMT
Posted on 28 April, 2025 at 12:00 GMT
Posted on 25 April, 2025 at 12:00 GMT
Posted on 23 April, 2025 at 11:00 GMT