Market Analysis Review
NFP: Less U.S. employment growth, A decline for Canada’s employment change, Unemployment rates for both higher, U.S. stocks continue with the uptrend while commodities dive
Previous Trading Day’s Events (05.07.2024)
Nonfarm payrolls increased by 175K jobs last month. Revisions showed 22K fewer jobs created in February and March than previously reported. Average hourly earnings rose 0.2% after climbing 0.3% in March. Wages increased 3.9% in the 12 months through April.
The unemployment rate rose to 3.9% from 3.8% in March amid increasing labour supply. Nonetheless, the jobless rate remained below 4% for the 27th straight month. Data this week showed job openings declining in March. Signs of labour market cooling raised optimism that the U.S. central bank could after all engineer a “soft-landing” for the economy.
Financial markets boosted the odds of a September rate cut and saw the Fed reducing borrowing costs twice this year instead of only once before the data.
The Fed on Wednesday left its benchmark overnight interest rate unchanged in the current 5.25%-5.50% range, where it has been since July. Since March 2022 the Fed has raised its policy rate by 525 basis points.
“We’re sticking with our call for a first ease in July,” said Michael Feroli, chief U.S. economist at JPMorgan. “The market is not there, but we believe that if the next two job reports show continued cooling in labour market activity, then the Fed will be comfortable taking back some of its policy restraint.”
Source: https://www.reuters.com/markets/us/us-job-growth-slows-april-unemployment-rate-rises-39-2024-05-03/
“A sustained deterioration is typically only seen during recessions,” Doug Porter, chief economist at BMO Capital Markets, wrote in a note, pointing to the 1.4-percentage-point rise in the jobless rate since January last year.
Canada lost a net 1.4K jobs in June, a further indication of weakness in economic conditions.
“Lowering interest rates is the only way to soften the blow from upcoming mortgage renewals and keep any hope of a soft landing alive,” he said, adding that the BoC would cut rates by 25 basis points this month and another two rate cuts in the three meetings thereafter.
Despite increasing unemployment, wage growth has been a sore point in the BoC’s efforts to tame inflation and it ticked up again in June.
The average hourly wage growth of permanent employees accelerated to an annual rate of 5.6% from 5.2% in May.
The central bank lowered its key policy rate for the first time in more than four years in June and said more cuts were likely if inflation continued to cool. The bank’s next rate announcement is on July 24, roughly a week after the release of the next inflation data, which is seen as a critical factor in firming up expectations for a definitive rate cut this month.
______________________________________________________________________
Winners vs Losers
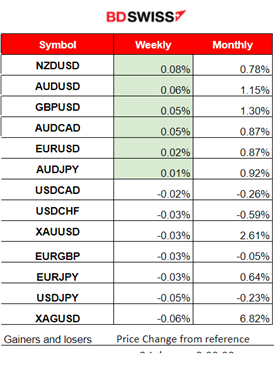
NZDUSD reached the top of the list at the start of the week with 0.08% gains. This month XAGUSD (Silver) won the most, 6.82% gains.
 ______________________________________________________________________
News Reports Monitor – Previous Trading Day (05.07.2024)
Server Time / Timezone EEST (UTC+03:00)
- Midnight – Night Session (Asian)
No important news announcements, no important scheduled releases.
- Morning – Day Session (European and N. American Session)
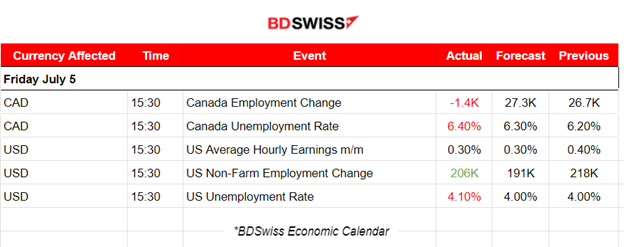
According to Canada’s employment data released on Friday, the jobless rate rose to 6.4% in June while there was a decline in the employment change figure surprising the markets. The CAD depreciated at the time of the release. The economy lost 1,400 jobs in June as the unemployment rate climbed to its highest level in more than two years. The June result was the highest reading for the unemployment rate since January 2022 when it was 6.5%.
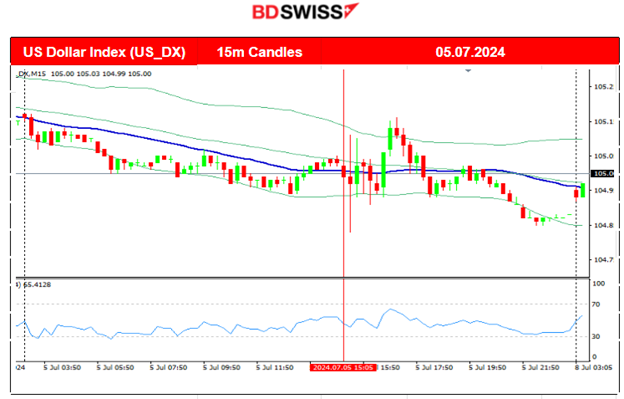
The NFP figure was reported to be 206K USD, higher than expected but lower than the previous figure. The unemployment rate rose to 4.1% from 4% suggesting cooling of the labour market and economy, coinciding with the other related data, especially the weak ISM services PMI. The chances for a September rate cut had risen to just over 70% at that time. The dollar was initially affected by depreciation, however, it stayed stable as the effect was not so great.
General Verdict:
 __________________________________________________________________
FOREX MARKETS MONITOR
EURUSD (05.07.2024) 15m Chart Summary
Server Time / Timezone EEST (UTC+03:00)
Price Movement
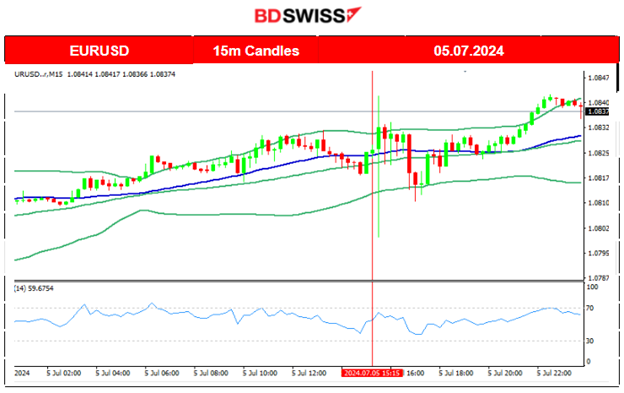
The pair stayed roughly stable on Friday. Despite the importance of the NFP data releases the market did not react much as there was not much of a surprise of the actual figure release. The expected downward direction of the NFP figure was priced in since the market participants already had data, such as the drawdown of the ADP report and important PMIs, to suggest a weakening of business conditions and the labour market. With the USD to depreciate steadily but not significantly the pair closed slightly higher.
USDCAD (05.07.2024) 15m Chart Summary
Server Time / Timezone EEST (UTC+03:00)
Price Movement
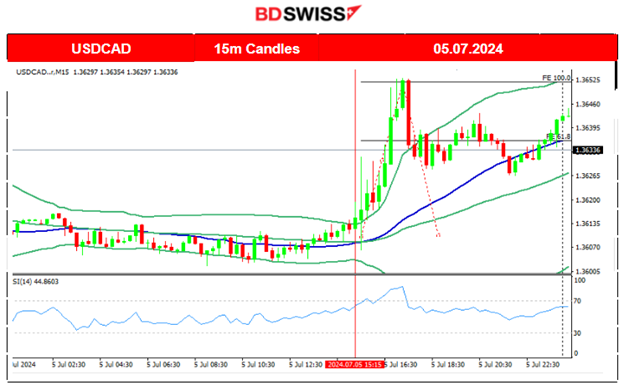
As you can see below, the pair was not affected much by the activity ahead of the news. At the time of Canada’s labour data release, the pair jumped since the CAD suffered depreciation. That was quite a surprise. The forecast was a 27.3K employment change but the actual figure was reported at -1.4K. The BOC had actually cut rates this year and that should have helped the labour market to grow. A decline, however, was recorded. The pair reached the resistance near 1.36525, after moving upwards exponentially before it retraced to the 61.8 Fibo level and remained close to the 30-period MA for the rest of the trading day.
 ___________________________________________________________________
CRYPTO MARKETS MONITOR
BTCUSD (Bitcoin) Chart Summary 1H
Server Time / Timezone EEST (UTC+03:00)
Price Movement
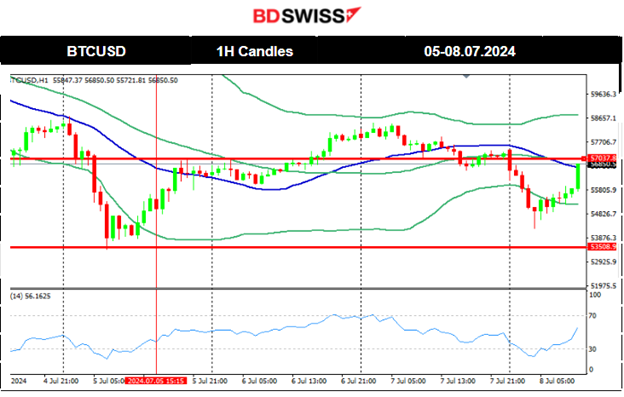
On the 2nd of July, a clear and steady downtrend took place that resulted in Bitcoin breaking more and more support levels, eventually reaching the 60,500 USD support level. On the 3rd of July, the price dropped further, reaching 60K USD. July 4th found Bitcoin even lower breaking another support and reaching 58K, which is a crucial support level. On the 5th of July, the price fell further breaking the 57K USD level and dropped to the next support at 54K USD. Since then the market recovered and corrected by moving upwards and crossing the 30-period MA. The price remained close to the MA as it continued moving sideways with a clear mean level at nearly 57K USD for now.
Crypto sorted by Highest Market Cap:
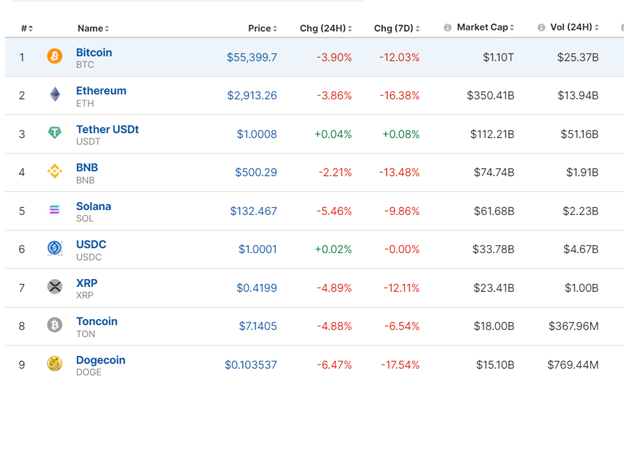
The 2nd of July was deterministic for Crypto. Most Crypto suffered losses and this extends until today as the market has experienced a strong downtrend recently. The last few days however we see some correction, eliminating some of the losses.
https://www.investing.com/crypto/currencies
______________________________________________________________________
EQUITY MARKETS MONITOR
S&P500 (SPX500) 4-Day Chart Summary
Server Time / Timezone EEST (UTC+03:00)
Price Movement
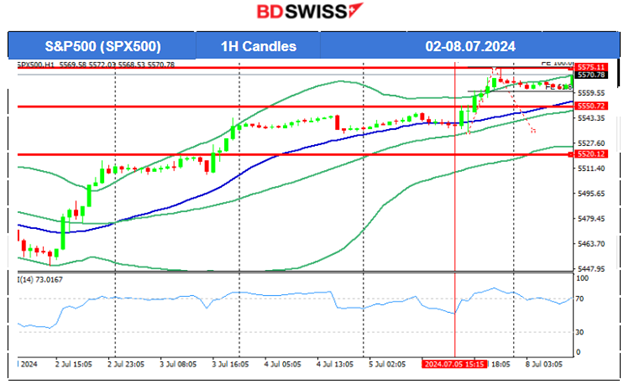
A slowdown took place on the 4th of July after the index experienced quite an increase in value. The other benchmark indices as well. Despite the stock market closure due to the holiday, some volatility was observed in index trading (futures) with the uptrend experiencing a slowdown. On the 5th of July, the index moved aggressively upwards again early during the Asian session on the index (futures) market opening. Retracement took place. Looking at things from afar, no significant correction is expected yet. A clear uptrend.
 ______________________________________________________________________
COMMODITIES MARKETS MONITOR
USOIL (WTI) 4-Day Chart Summary
Server Time / Timezone EEST (UTC+03:00)
Price Movement
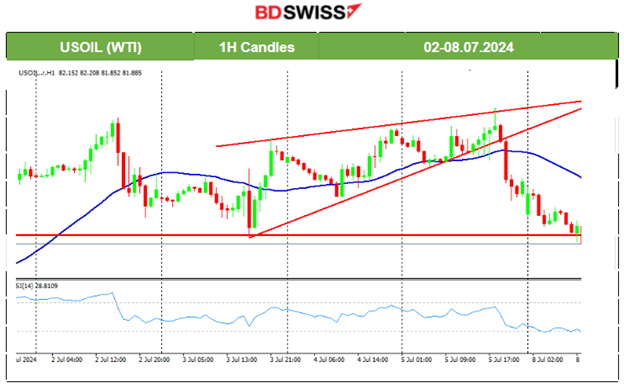
Since the 1st of July a new trend started with the price reaching 83 USD/b. On the 2nd however, the price retraced to the 30-period MA testing the 82.3 USD/b support. Despite the breakout of that support and the channel that formed, there was not a significant downside movement. The support was strong enough and the price moved sideways around the mean on the 3rd of July. On the 4th, the price remained above the 30-period MA and continued upwards within the channel. However, a triangle formation was formed and on the 5th of July after 18:00 server time, the price dropped heavily breaking that triangle to the downside. The price continues to drop until now and historical prices are not providing an apparent support area so far. 81.20 however, seems to be an important mean level that the price could reach next as it falls currently.
XAUUSD (Gold) 4-Day Chart Summary
Server Time / Timezone EEST (UTC+03:00)
Price Movement
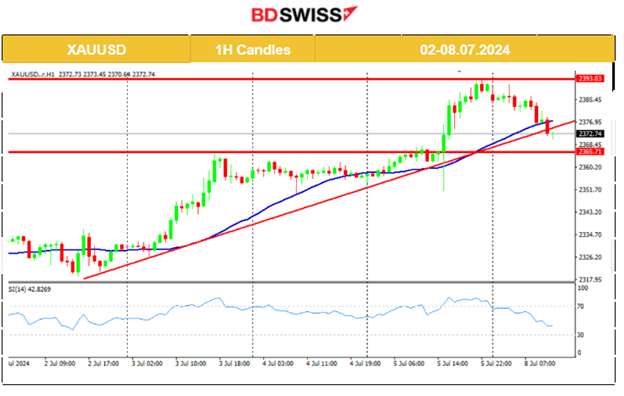
A steady sideways movement took place on the 4th of July with the price closing bear flat as volatility levels lowered. Gold jumped due to the USD’s early depreciation and tested the high at 2,365 USD/oz on the 5th of July. On the same day, it jumped again during the NFP release. It was an intraday shock that resulted in increased demand for metals, pushing Gold upwards in order to technically complete the breakout of the previous triangle formation and reaching the next target level at nearly 2,393 USD/oz as mentioned in our webinar on Friday. On the 8th, today, it corrected from that jump.
 ______________________________________________________________
News Reports Monitor – Today Trading Day (08.07.2024)
Server Time / Timezone EEST (UTC+03:00)

- Midnight – Night Session (Asian)
No important news announcements, no important scheduled releases.
- Morning – Day Session (European and N. American Session)
No important news announcements, no important scheduled releases.
General Verdict:
______________________________________________________________

