Weekly Outlook
U.S. CPI and PPI Data Higher than Expected, USD Strengthened Further, Crude Finds Resistance, U.S. Stock Market Settles Lower
PREVIOUS WEEK’S EVENTS (Week 07 Aug – 11 Aug 2023)
Announcements:
U.S. Economy
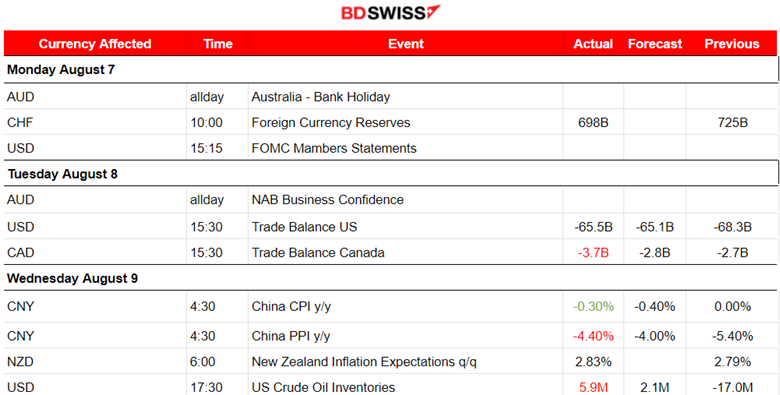
The U.S. Census Bureau and the U.S. Bureau of Economic Analysis announced that the goods and services deficit was $65.5 billion in June, down $2.8 billion from $68.3 billion in May, revised.
Imports fell to the lowest level in more than 1-1/2 years. The decline in imports reported by the Commerce Department signals a slowdown in business investment and overall domestic demand amid hefty interest rate hikes from the Federal Reserve.
Last week, the U.S. crude inventory data showed an increase of 5.9 million barrels. Oil climbed to high levels as the market dealt with supply tightness concerns and fuel demand worries ahead of the CPI data released today / U.S. inflation data.
Brent crude rose by 0.3%, to 87.81 USD/b, hitting its highest since the 23rd of January. West Texas Intermediate (WTI) crude also gained 0.3%, to 84.65 USD/b, a price last seen in November 2022.
Crude Oil
Supply tightness due to tensions between Russia and Ukraine and the extended production cuts by Saudi Arabia are causing rising prices.
Saudi Arabia’s plans were announced recently, involving the extension of its voluntary production cut of 1M barrels per day for another month to include September. Russia also said it will cut oil exports by 300K bpd in September.
_____________________________________________________________________________________________
Inflation
U.S.:
Rate hikes have proved that they have a great impact on inflation.
According to Federal Reserve Governor Michelle Bowman, the U.S. central bank might raise rates further. The Fed’s July rate hike brought the federal funds rate to a range of 5.25% to 5.5%.
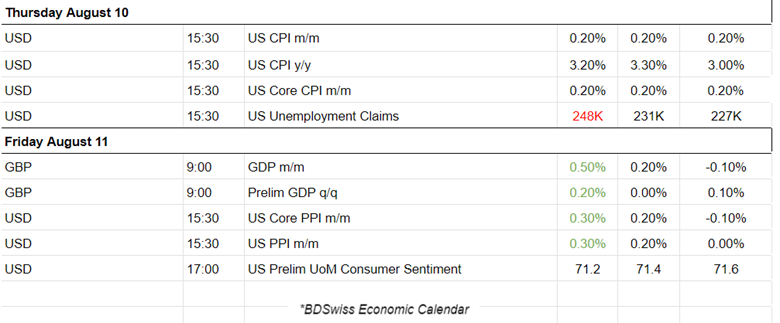
The CPI changes figures released yesterday showed that inflation pressures from last month continued, leading to the first rise in consumer prices in over a year. According to the Bureau of Labor Statistics data, prices actually rose to 3.2% in July since last year. The annual increase in prices, excluding the volatile food and energy components, the so-called core inflation, was the smallest in nearly two years. The U.S. Consumer Price Index (CPI) rose 0.2% last month, matching the gain in June.
Now, we have an outlook of a moderate inflation rate, together with a cooling labour market. Unemployment claims were reported higher than expected, adding to the idea of the labour market cooling.
According to the PPI data, U.S. producer prices increased slightly and more than expected in July. The Producer Price Index for final demand increased by 0.3% last month. In the 12 months through July, the PPI increased 0.8% after gaining 0.2% in June, boosted by a lower base of comparison last year. The price increase serves as a signal that inflationary pressures are still in effect to some degree against the Federal Reserve’s rate hiking campaign. Most economists expect the Federal Reserve to keep interest rates unchanged at its next month’s policy meeting.
The University of Michigan’s consumer sentiment survey on Friday showed a fall in expectations to 3.3% in August from 3.4% in July. They have been stable for three consecutive months.
The Fed’s 2% target is far from being reached and further work is to be done. With the CPI and PPI data in hand, economists estimated that the core personal consumption expenditures price index increased 0.2% in July, matching June’s gain.
The PCE price index data will be published later this month.
_____________________________________________________________________________________________
Source:
https://www.reuters.com/markets/us/us-trade-deficit-narrows-june-imports-decline-2023-08-08/
https://www.reuters.com/markets/us/us-producer-prices-increase-july-rebound-services-2023-08-11/
____________________________________________________________________________________________
Currency Markets Impact – Past Releases (Week 07 Aug – 11 Aug 2023)
_____________________________________________________________________________________________
FOREX MARKETS MONITOR
DXY (US Dollar Index)
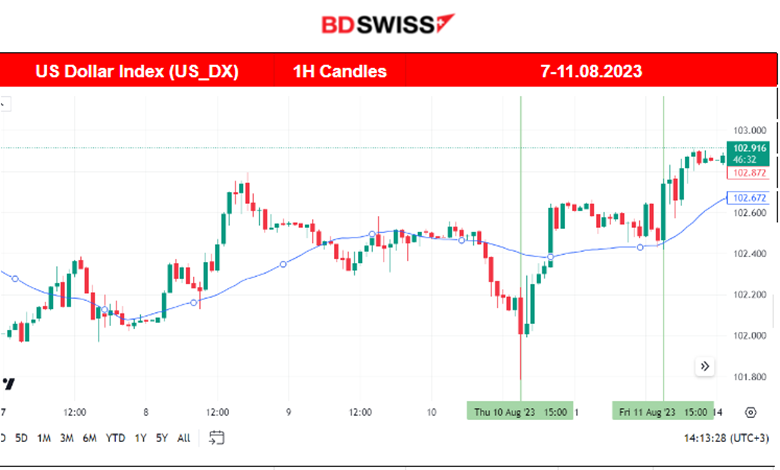
The Dollar experienced strength again last week. The index was moving upwards while being over the 30-period MA but reversed on the 10th of August when the lower-than-expected CPI data were released. The market, however, reversed again quite quickly, with USD appreciation causing it to gain strength overall. The PPI data seem that they did not have much impact, expecting USD depreciation, since the USD experienced resilience instead, even after they were reported higher.
EURUSD
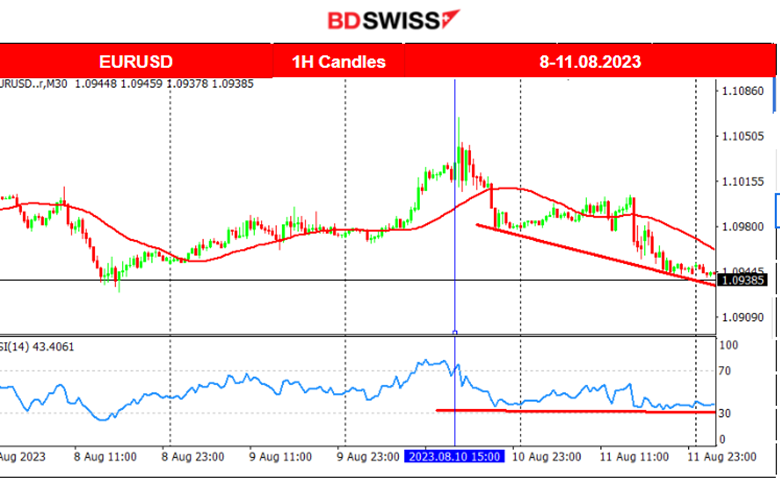
Obviously, the USD is driving the pair path. The EURUSD has been experiencing volatility with no clear direction, more to the downside as it seems, and the USD strengthened overall. The RSI is showing signs of bullish divergence.
_____________________________________________________________________________________________
NEXT WEEK’S EVENTS (14 Aug – 18 Aug 2023)
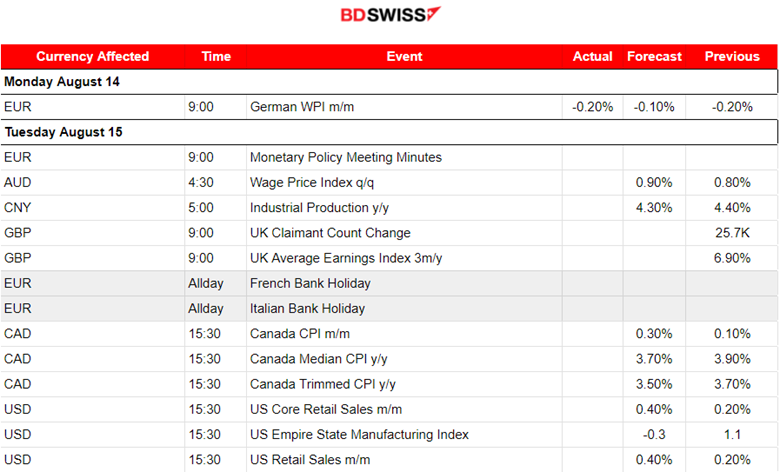
Important news this week involves Canada’s Inflation data released on the 15th of August. On the same day, we have the release of the U.S. retail sales data.
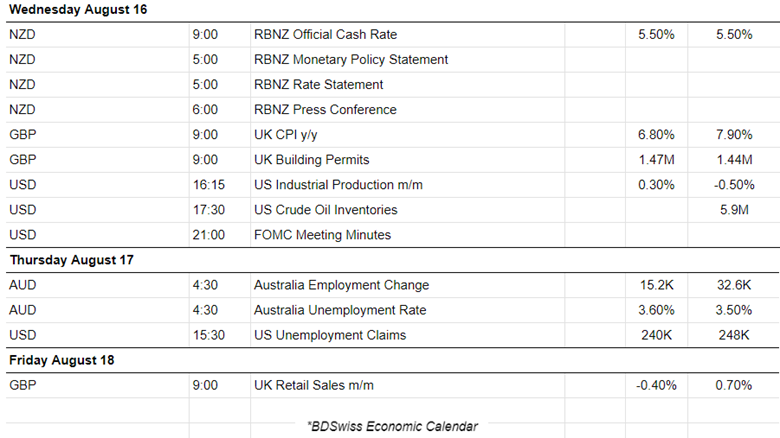
On the 16th, we have the release of the RBNZ decision on rates. At 21:00 the same day the FOMC Meeting Minutes report will be released.
Currency Markets Impact:
_____________________________________________________________________________________________
COMMODITIES MARKETS MONITOR
U.S. Crude Oil
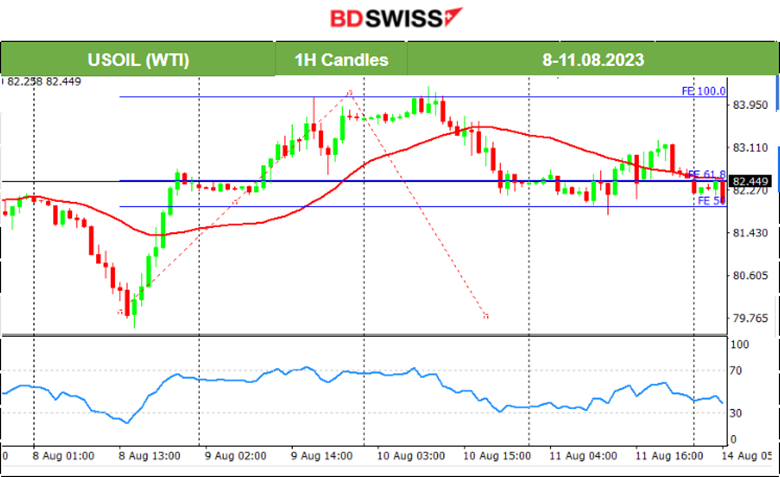
Crude shows signs of a slowdown. The RSI was in the overbought area and some reversal was expected. Eventually, a retracement took place back to the mean, finalising on the 10th of August. Crude is probably on a sideways path which is actually quite volatile with no clear direction.
Gold (XAUUSD)
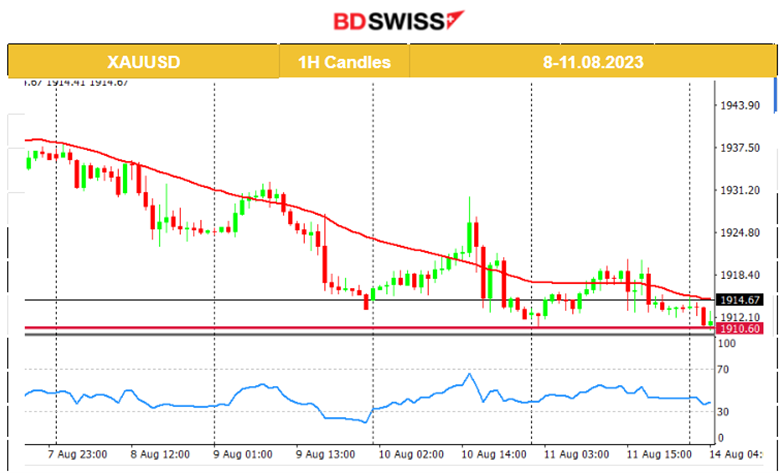
As the USD is gaining strength, we see Gold moving lower and lower. However, Gold has currently shown signs of slowing down testing the supports near 1910 USD/oz frequently. The RSI shows signs of bullish divergence, though will this continue? A downtrend is apparent, the MA is obviously going down and a reversal is possible but the price in that case will probably move only sideways in case the trend ends, at least for the short term.
_____________________________________________________________________________________________
EQUITY MARKETS MONITOR
NAS100 (NDX)
Price Movement
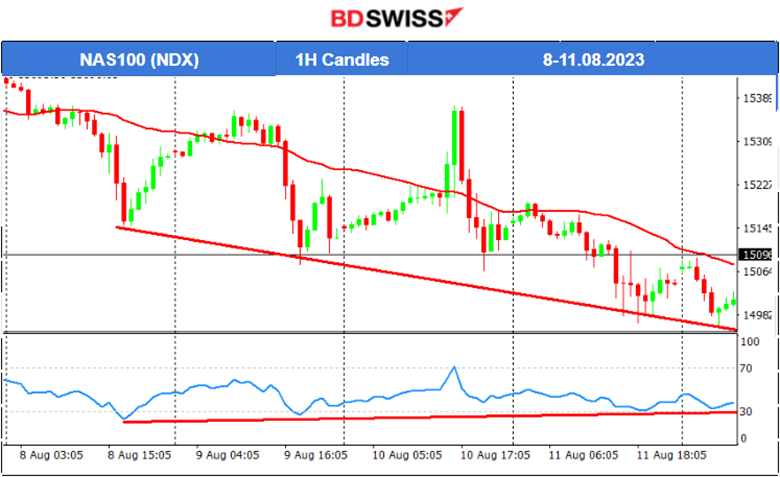
After the recent announcements from Fitch Rating and Moody’s, the U.S. stock market suffered a downtrend. The benchmark U.S. indices are moving to the downside but at a highly volatile pace. On every recent market/exchange opening, we see the NAS100 moving rapidly to the downside before retracing back to the mean. It is still remaining below the 30-period MA and breaks support levels on its volatile way to the downside. The downward trend is clear and there are no signs that it will end soon.
______________________________________________________________

