


Weekly Outlook
Which way will it go?
The US consumer price index (CPI) for July shocked the markets when it came out: 8.5% yoy, down from 9.1% yoy. It was expected to be 8.7% yoy, so markets were delighted to see it coming down faster than expected. Inflation has peaked! Central banks won’t have to tighten that much! We can keep on partying!
Exactly a week later, the UK CPI hit everyone for a loop: 10.1% yoy, up from 9.4%. It had been expected to rise but only to 9.8%. Far from peaking, UK inflation is accelerating faster than anyone had expected.
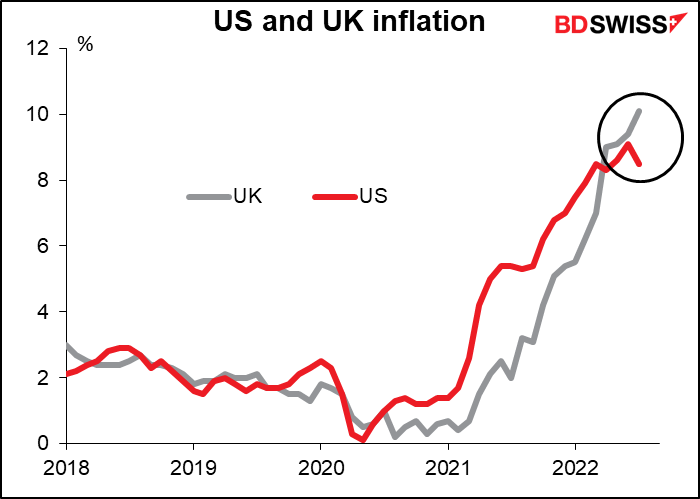
Which one is the real story here for global inflation?
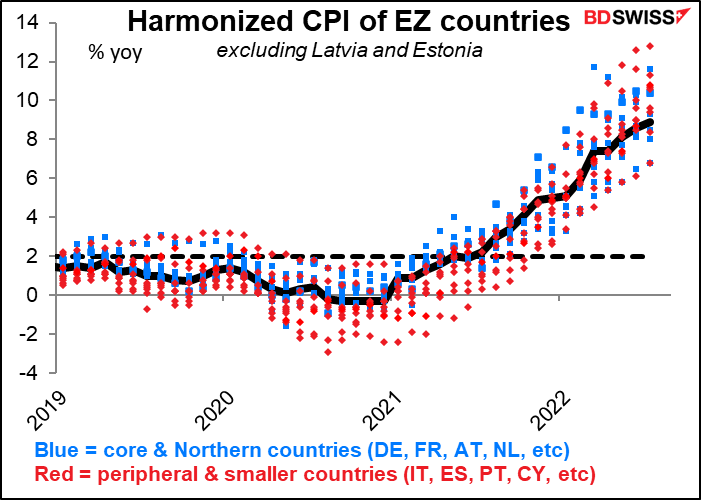
The answer probably is that there is no such thing as global inflation. That while each country is affected by some of the same factors – oil prices, shipping costs, shortages of semiconductors – each country also has its own problems that affect its inflation rate. The housing market, energy mix, food supplies, labor market…there are many local variables in inflation. We can see that within the Eurozone, where every country shares the same currency but inflation rates currently range from 6.8% yoy (France and Malta) to 23.2% yoy (Estonia, not shown).
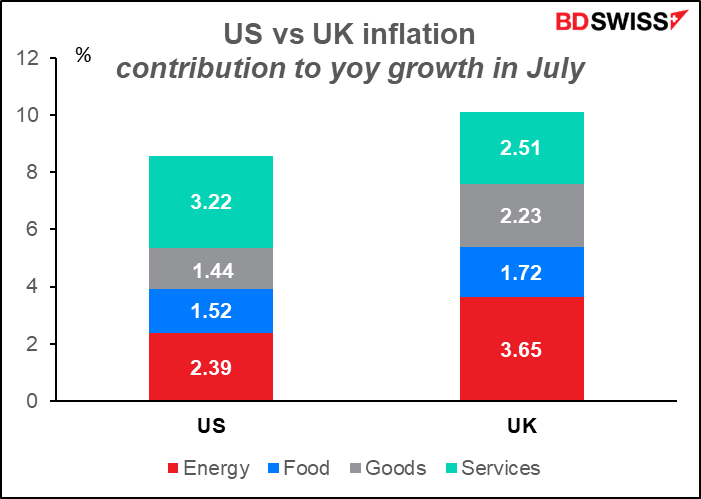
In the US, the main items pushing up the inflation rate in July were services. Energy is #2. But in the UK, energy prices were #1 – they’re rising much faster than in the US, as one might well imagine. But so too are core goods. Meanwhile prices of services are certainly rising but not as rapidly as in the US, despite the Bank of England’s obsession with keeping wages low to prevent a wage/price spiral. If there were one to be found it would be in the service sector, but it’s not (so far).
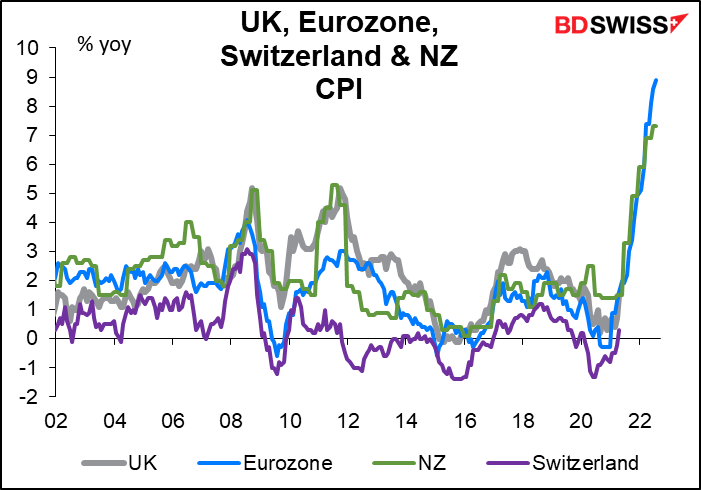
Which country might follow the UK? I looked into this question using a mathematical tool called regression analysis. To make a long story short, the computer looks to see how well several data series match the one you’re looking at. For the UK headline inflation, the Eurozone was #1, followed by New Zealand and then Switzerland, of all places. This struck me as strange because New Zealand is known for its historically high inflation while Switzerland is known for its relatively low inflation. But if they follow the same trend then the level doesn’t matter so much to the computer as the pattern of changes.
When it comes to UK core inflation though it’s the US, Canada, and Australia, followed closely by Italy (not shown).
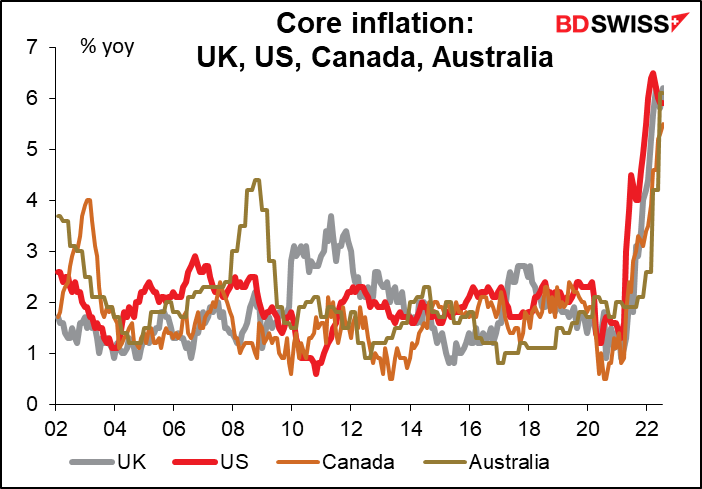
The curious point in this exercise is that the UK’s inflation pattern tends to follow the same path as that of the commodity currencies (New Zealand for headline, Canada and Australia for core) more than nearby countries such as France and Germany. In fact for core inflation, the coefficient for France was negative—that is, the relationship between core inflation in the UK and France is inverted, even though the two do have a pretty good relationship for headline inflation (just a little below Switzerland). On the other hand, while Switzerland and the UK have a fairly strong correlation for headline inflation, as mentioned above, the relationship between their core inflation measures is also negative, like with France (as are Norway and Ireland). The relationship between the UK and German core inflation is not statistically significant.
What do I conclude from this exercise? If I had more time to dig into the components of inflation in each country it might be possible to better explain the linkages and why one is related to another and why others aren’t. I don’t have the time though and this isn’t a PhD thesis on global inflation linkages. What I want to point out is this: there are many individual factors affecting inflation in each country. You have cases where the headline inflation rates are closely correlated but the core inflation rates are inversely correlated. We therefore can’t draw any universal lesson from Britain’s unfortunate experience. It’s possible that the UK is a leading index of where global inflation is headed, but it’s also possible that it’s an outlier, the mirror image of Japan.
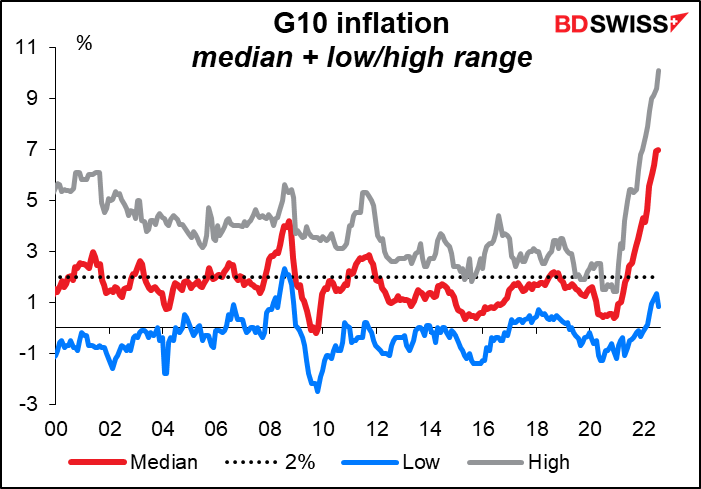
Inflation rates used to be much more dispersed. In 2000 the difference between the lowest and the highest inflation rate in the G10 averaged 630 bps. In 2018-19 that had fallen to around 260 bps. We can expect more dispersion among inflation rates going forward. The appropriate monetary response will also then vary country by country. That should give rise to more trading opportunities for fundamental traders.
One might therefore conclude to buy AUD and NZD, because they used to be the highest-inflation currencies and therefore have the highest interest rates. However, perhaps the most significant point about Wednesday’s UK inflation announcement insofar as traders are concerned is that it didn’t help the pound. On the contrary, the pound fell afterward. That might have been due to fears that against the background of Britain’s weak economy, the Bank of England wouldn’t be able to tighten enough to restrain inflation. Or perhaps it was due to the “risk-off” mood that subsequently engulfed markets, as the pound has become a relatively risk-sensitive currency recently.
Or perhaps it signifies a change in the market’s “reaction function” to high inflation. Could it be that the market will start rewarding countries with lower inflation because it means higher growth and therefore better investment opportunities in the future? We’ll have to see how the market responds to changes in inflation in other countries.
Next week: Jackson Hole, here we come!
There aren’t so many important economic indicators out next week. Tuesday we get the preliminary purchasing managers’ indices (PMIs), which will be closely watched after this week’s disastrous Empire State manufacturing survey sent recession jitters down the market’s collective back (although the Philadelphia Fed’s version of this index surprised on the upside!) On Wednesday the US announces durable goods orders and on Friday, personal income and spending with their sidekick, the personal consumption expenditure (PCE) deflators. Outside of that, the Ifo indices (Thursday) and Tokyo CPI (Friday) pretty much round out the schedule.
Given the light calendar, it’s a good week to take some time off and perhaps go fishing, for those of you who enjoy that sport. One person who did was the redoubtable Paul Volcker, the 2.01 meter (6’7”) Fed chair from 1979 to 1987. The Kansas City Fed started holding an annual symposium in 1978. In 1982 they wanted Mr. Volcker to attend so they moved the symposium to Jackson Hole, Wyoming, so that he could go fishing there. It’s been held there ever since.
The topic this time is “Reassessing Constraints on the Economy and Policy.” The agenda isn’t available yet; usually it only goes up on the Kansas City Fed’s website shortly before the symposium begins. The symposium will be Thursday through Saturday.
The symposium brings together the great and the good in central banking and academic economics and is often – but not always – the site of some big announcement or hint to the market. Fed Chair Powell will speak on the economic outlook at 14:00 GMT Friday. Usually one or two other central bank heads are there too – last year there weren’t but the year before we had ECB Chief Economist Lane, Bank of Canada Gov. Macklem, and Monetary Authority of Singapore Chairman Shanmugaratnam. The year before, during pre-pandemic time, it was Bank of England Gov. Carney, RBA Gov. Lowe, and Bank of Israel Gov. Yaron. Etc.
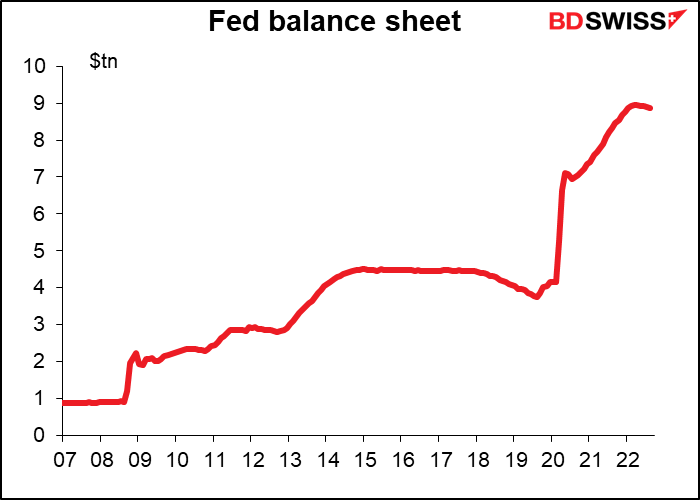
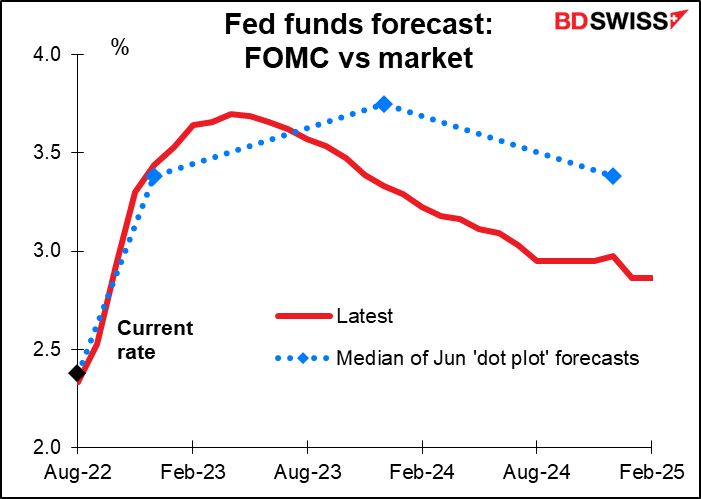
Reuters reported that Chair Powell may give some guidance on the Fed’s program to shrink its balance sheet, aka “quantitative tightening” or QT (the reverse of quantitative easing, or QE). The idea is that he’s talked about rates until he’s blue in the face, and besides, the Fed doesn’t know any more than the market does about how inflation will develop and therefore how they’re likely to move rates.
Former New York Fed Chair and FOMC Vice Chair William Dudley noted that Powell’s speech last year was “wrong in several important ways,” namely underestimating the inflationary pressures in the economy. He continued:
Powell surely hopes this year’s speech will prove more prescient. I expect him to emphasize three themes: that the economy still has forward momentum with an extremely tight labor market and unacceptably high inflation, that the Fed must tighten monetary policy further to restrain the economy and ease pressure on the labor market, and that the Fed won’t relent until it’s sure it has done enough for long enough to achieve its 2% inflation target.
These are of course the same themes Powell has been hammering home time after time, or as they say in Japan, “until my mouth becomes sour.” Nonetheless, if it convinces the market that their estimate of the likely path of interest rates is too, too different from what the Committee members are thinking, it could cause a repricing of interest rate expectations further out that would be positive for the dollar.
As for the indicators, the focus on the US will be on Friday’s personal income and spending and the accompanying personal consumption expenditure (PCE) deflators.
At the moment, personal income is expected to be up 0.6% mom and personal spending +0.5%. For incomes that would be about average – the six-month moving average for that series is +0.5% mom. So it would imply incomes continue to grow steadily. The spending figure would be down from the monthly average of +0.9% mom, but of course that figure is quite volatile. I’d say it still represents solid consumption. Accordingly, I think these figures would reassure investors that the sky isn’t falling just yet and that markets can continue to move higher.

The PCE deflators, not the consumer price index (CPI) are the Fed’s preferred inflation gauges. When Fed officials forecast inflation in their Summary of Economic Projections every quarter, this is what they’re forecasting, not the CPI. However, the market clearly pays more attention to the CPI than to the PCE deflators, if we can judge from the Bloomberg relevance scores (60 for the highest-rated PCE deflator vs 96 highest-rated CPI measure). And my impression is that Fed officials do too, even if they phrase their forecasts in terms of the PCE deflators. For example, in his press conference last December, Fed Chair Powell mentioned the CPI three times but didn’t mention the PCE deflators at all. Other Committee members have made similar comments. Maybe they’re just using “CPI” as a shorthand for “inflation,” but I doubt it.
The month-on-month rate of increase is expected to fall sharply for both: to +0.1% mom from +1.0% mom for the headline figure and to +0.3% mom from +0.6% mom for the core figure.
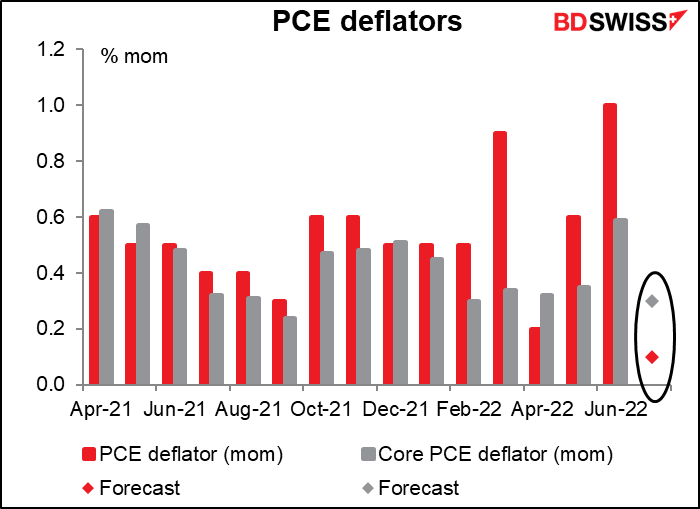
This would go along with the sharply lower month-on-month rate of growth in the CPI: the headline CPI for July was unchanged mom vs +1.3% mom the previous month, while the core CPI was up 0.3% mom vs +0.7% mom the previous month. It would corroborate the slowdown in inflation in the US, which might be negative for USD – depending of course on what comes out of Jackson Hole that day.
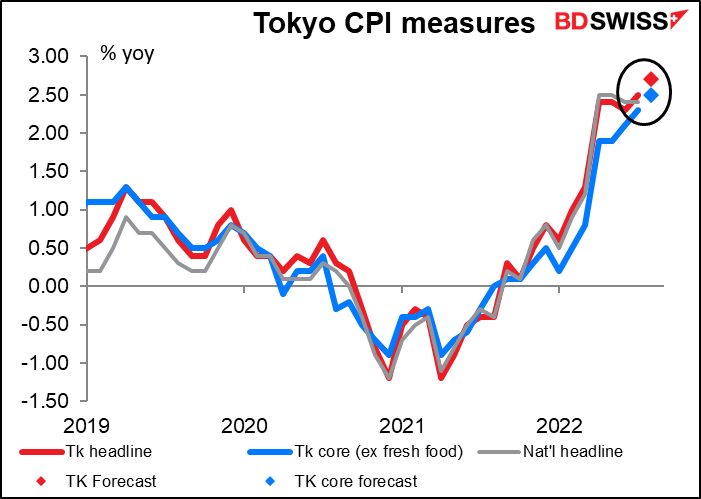
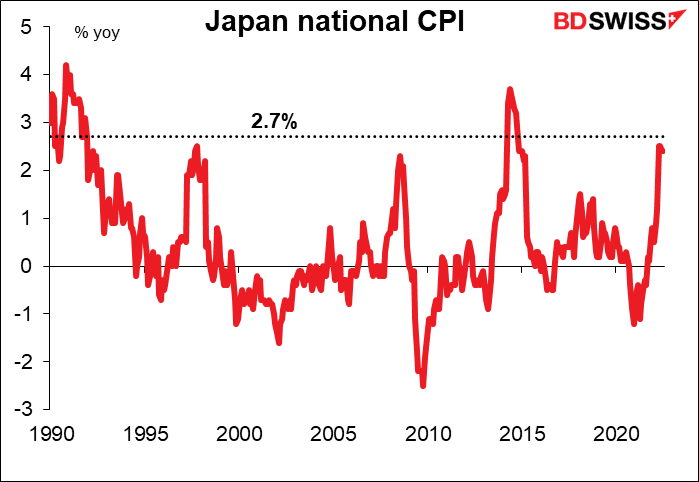
The only other inflation reading we’ll get next week is the Tokyo CPI on Friday. Both measures are forecast to be 0.2 percentage points higher, meaning 2.7% yoy for the headline figure and 2.5% yoy for the Japan-style “core” measure (excluding fresh foods but including energy).
While this would be relatively modest inflation for any other country nowadays, it’s been a long long time since we’ve seen inflation like this in Japan: since 1992, to be precise. (The CPI did go over that rate temporarily in 2014 but that was only because the consumption tax was raised.)
Will this shift Bank of Japan thinking? Probably not. But it could shift market thinking. We have to be prepared for the possibility that investors might shift their funding currency from JPY into EUR. I’m still bearish JPY (bullish USD/JPY) but I check the rates every day anyway.
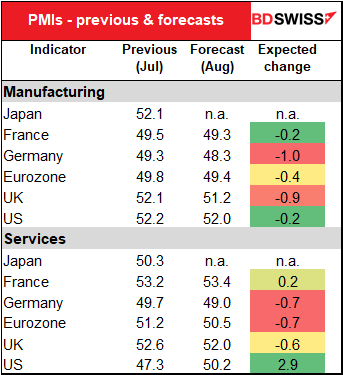
Finally, there are the preliminary purchasing managers’ indices (PMIs) from several of the major industrial economies.
The manufacturing PMIs are all expected to decline, including in Europe, where they’re already in contractionary territory. That may add to the euro’s woes.
The service-sector PMIs are mixed. The Eurozone and UK are expected to decline modestly (but remain over the 50 “boom-or-bust” line). The stand-out here is the US, where the service-sector PMI is forecast to leap higher, poking its nose back above the 50 line.
All in all, I’d expect the PMIs to add to the dollar’s strength. They’re likely to add to the conviction that the Eurozone and the UK are near recession but the US economy is still robust. US economic performance is likely to lead to US currency outperformance.
 BDSwiss
Recent Posts
Posted on 25 April, 2025 at 12:00 GMT
Posted on 14 April, 2025 at 12:00 GMT
Posted on 26 March, 2025 at 12:00 GMT
Posted on 14 March, 2025 at 12:00 GMT
Posted on 20 February, 2025 at 12:00 GMT